Hi All
I have done the following tutorial
Visualize Your Sensor Readings from Anywhere in the World (ESP32/ESP8266 + MySQL + PHP)
and would like to change the graphs from line graphs to spline graphs as per the high charts website.
https://www.highcharts.com/demo/spline-symbols
Any ideas how I would change the code to suit?
Hi.
If you take a closer look, you can see that the symbols are used in the following lines:
marker: {
  symbol: 'url(https://www.highcharts.com/samples/graphics/sun.png)'
}
In this case, the symbol is a URL to an image.
Here you have another example with the image in base64:
And here’s the documentation: https://api.highcharts.com/highcharts/series.line.marker.symbol –> search for “symbol” on that page.
I hope this helps.
Regards,
Sara
Hi Sara
I want to change the graphs from Line style to the curvy Spline style
This is the code in the tutorial
var chartT = new Highcharts.Chart({
chart:{ renderTo : 'chart-temperature' },
title: { text: 'Roof Temperature' },
series: [{
showInLegend: false,
data: value1
}],
plotOptions: {
line: { animation: false,
dataLabels: { enabled: true }
},
series: { color: '#059e8a' }
},
xAxis: {
type: 'datetime',
categories: reading_time
},
yAxis: {
title: { text: 'Temperature (Celsius)' }
//title: { text: 'Temperature (Fahrenheit)' }
},
credits: { enabled: false }
});

The code in the highchart library is very different.
How do I change my current code?
Hi.
I’m sorry. I thought you wanted to add symbols to the chart.
To make the lines curvy, you just need to add:
type: 'spline'
to the chart properties.
So, the first lines of your chart will be like this:
var chartT = new Highcharts.Chart({chart:{
  renderTo : 'chart-temperature'
  type: 'spline'
},
....
I hope this helps.
Regards,
Sara
Hi.
I’m sorry, there is a coma missing.
var chartT = new Highcharts.Chart({
chart:{
renderTo:’chart-temperature’,
type: ‘spline’
},
Now it works.
Let me know if it works for you too.
Regards,
Sara
It still not working
Here is the new code and still just the heading
var chartT = new Highcharts.Chart({
chart: { renderTo : 'chart-temperature'},
type: ‘spline’
},
title: { text: 'Roof Temperature' },
series: [{
showInLegend: false,
data: value1
}],
plotOptions: {
line: { animation: false,
dataLabels: { enabled: true }
},
series: { color: '#059e8a' }
},
xAxis: {
type: 'datetime',
categories: reading_time
},
yAxis: {
title: { text: 'Temperature (Celsius)' }
//title: { text: 'Temperature (Fahrenheit)' }
},
credits: { enabled: false }
});
Hi.
You have a typo in your code.
The first lines should be like this:
var chartT = new Highcharts.Chart({
chart: { renderTo : 'chart-temperature',
type: ‘spline’
},
You had an extra “}”
Regards,
Sara
Hi Sara
I’m still trying to figure this out.
If I put your code it the heading is the only thing that shows.
Here’s my code again
var chartT = new Highcharts.Chart({
chart: { renderTo : 'chart-temperature' },
title: { text: 'Roof Temperature' },
series: [{
showInLegend: false,
data: value1
}],
plotOptions: {
line: { animation: false,
dataLabels: { enabled: true }
},
series: { color: '#059e8a' }
},
xAxis: {
type: 'datetime',
categories: reading_time
},
yAxis: {
title: { text: 'Temperature (Celsius)' }
//title: { text: 'Temperature (Fahrenheit)' }
},
credits: { enabled: false }
});
Hi.
Try it like this:
var chartT = new Highcharts.Chart({
chart: { renderTo : 'chart-temperature',
type: 'spline'
},
title: { text: 'Roof Temperature' },
series: [{
showInLegend: false,
data: value1
}],
plotOptions: {
line: { animation: false,
dataLabels: { enabled: true }
},
series: { color: '#059e8a' }
},
xAxis: {
type: 'datetime',
categories: reading_time
},
yAxis: {
title: { text: 'Temperature (Celsius)' }
//title: { text: 'Temperature (Fahrenheit)' }
},
credits: { enabled: false }
});
Does it work?
Rgards,
Sara
Hi Sara.
I have the spline curve now but have lost the data on the graph. Each point on the graph was showing the value of the point. Now it is just a point.
If I could workout how to post a screen shot I would
Hi.
You just need to do that small change in your JAvaScript code.
chart:{
  renderTo : 'chart-temperature',
  type: 'spline'
},
Maybe you’re doing something wrong or I’m not explaining myself clear enough.
Here is an example project I’ve made that works with the spline.
I’m sharing with you the HTML and the Arduino sketch so that you can compare with your project and see if you can figure out what is wrong.
- Arduino sketch: https://raw.githubusercontent.com/RuiSantosdotme/Random-Nerd-Tutorials/master/Projects/ESP/ESP_Chart_Web_Server/ESP_Chart_Web_Server.ino
- HTML file: https://gist.github.com/sarasantos/e3c37d32fcfba03494c43d78dca155e3
I hope this helps.
Regards,
Sara
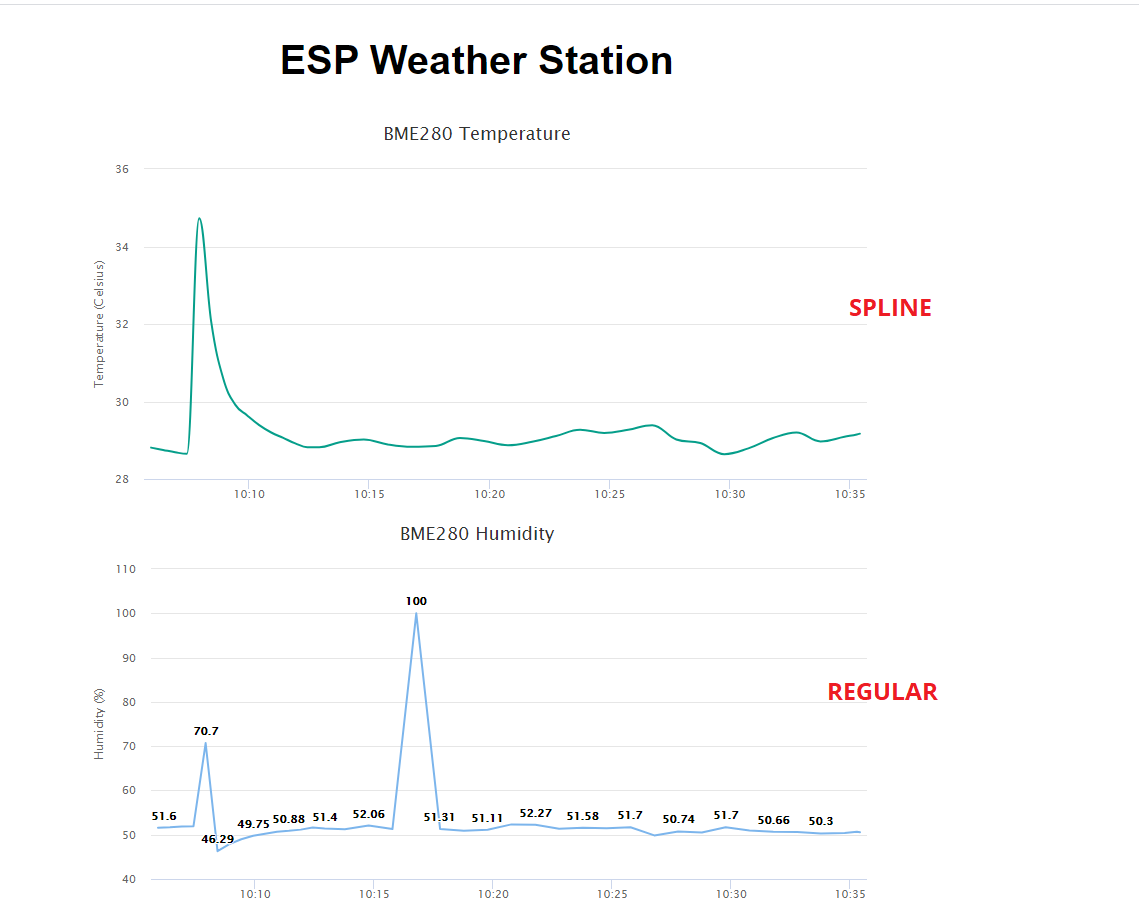
Hi Sara
I just copied and pasted so mine now looks like the top one. I want it to look like the top one but with the data labels like the bottom one.