Everything works perfectly in “MQTT – Connect ESP32/ESP8266 to Node-RED” but now I’d like to edit Node-Red and change the chart from an hour to two hours or more with temperature data. How does one edit Node-Red?
Hi Gayland.
After having the Raspberry Pi powered on and with the Node-RED flow imported, go to your Raspberry Pi IP address followed by :1880.
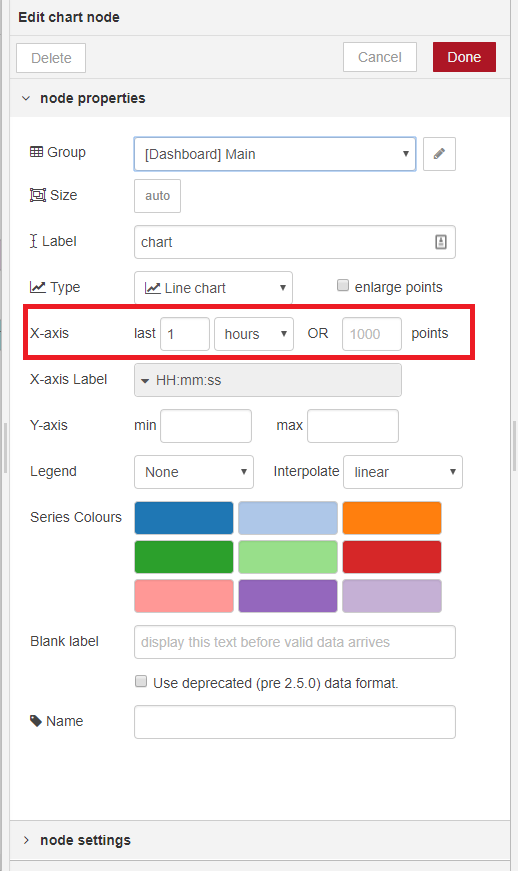
Then, double-click the chart flow, and edit the x-axis, as shown in the following figure:

Then, click the Deploy button for the changes to make effect.
I hope this helps,
Regards,
Sara
Sorry Sara, but I can’t get this started again after I made the change to increase the chart size, one hour to six hours. Led doesn’t go on and no temperature data collected.
What needs to be done to get this going again?
That is very weird. Did you change anything else?
Can you delete that node and make it from scratch?
Are you getting any errors?
Regards,
Sara
Sorry I didn’t respond soon but everything is working now. I believe that I didn’t wait long enough for the data to fill the chart. Now I’m running a 12-hr chart and it works perfectly except for spurious points that take the chart down to zero. Takes some of the sensitivity out of the chart data plot.
Thanks again for all your help. You’re doing a great job.