Greetings,
I just finished module 5.3 in your book “Smart Home with Raspberry Pi ESP32 and ESP8266 V1-3”. (With the three graphs and gauges).
It works just fine.
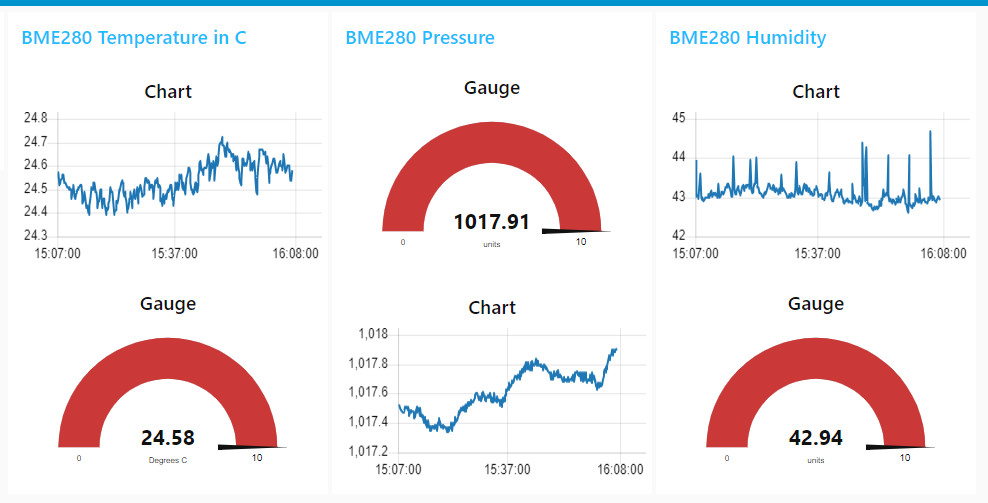
However, on my dashboard (using Node_Red v 3.1.3), two of the group show the chart on top, but one group shows the gauge on top (see picture). I would like to have them all the same, but I can’t find anything how to control what goes where in a group. How can I do control what goes where?
My 2nd question is: I can’t get the colors to change (for either chart nor gauge): If I click on a color, a color picker pops up, but there is no way I can select a color: tried everything (clicking, double clicking), but nothing seems to work. Any idea? 😉
Thanks in advance.

I can already answer my own question about why I cannot set colors:
Gauges:
I forgot to set the min max fields to reasonable values, so they were at their default 0 – 10 values.
As it turns out, when your received values are outside the min max range, you can’t change colors. (Node_RED bug?)
Once you set a proper range, you can now change the color.
But when you change the color, you have to change something else as well. If you ONLY change the color, you’re not given an option to re-deploy.
Question: on page 201 of the above mentioned book you show an example of what it all should look like: and you have on gauge in blue. How do you do that, since the color choices (see your page 199) only has green, yellow, and red?
While the above is true for gauges, I still can’t set a color for charts!
Hi.
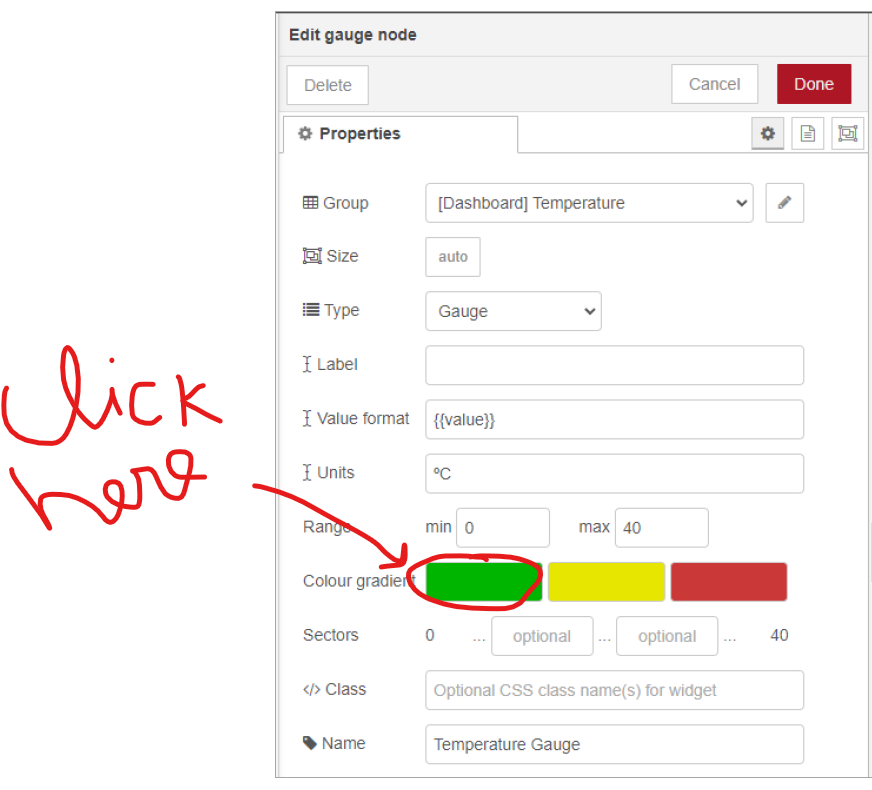
To change the colors, you just need to click on the color when you open the Edit gauge node. See the picture below

Let me know if this helps.
Regards,
Sara
Thanks, Sara, for your response.
Unfortunately, for some reason, your suggestion doesn’t work for me: when I click on a color, a color picker pops up, and there’s no clear way to actually ‘select’ a color’. If I then click on ‘Done’ (and I don’t change anything else) I can’t ‘Deploy’ my flow. (‘Deploy’ is greyed out).
I may have to capture this in a screen dump video to show what I do.
1. What version of Node-RED are you using?
2. How about my first question: how can I change the positions (top, bottom) of my chart and gauge in one of my groups (see the picture above).
3. How did you (in your example) get a BLUE gauge, as there is no blue color showing at ‘Colour gradient’ (see your own picture above)?
Kind regards,
~ Paul
Hi.
I’ve made a quick video showing how to select different color. Basically after selecting the color on the color picker, simply click out of the window.
To change the order, in the top right corner, there’s a little triangle facing down. Click there, and select Dashboard. Then, select the Layout tab. You should see all your dashboard widgets and the way they are arranged. To change the order, you can simply drag them to a different position.
Let me know if this helps.
Regards,
Sara
Greetings,
To start with the last item in your response (the order of widgets in a group): that worked great: thanks! Apparently, the order in which widgets appear is dependent on the order you create them (first ones on the bottom).
As for the gauge color: thanks for taking the time to create that video: much appreciated.
However, it still wouldn’t work for me, in fact I had done exactly the same thing myself.
So, I spent some time experimenting (and reading the help info for the widget) which made me realize I didn’t really understand how those colors work: I thought that f I want a green gauge, click on green, if I want red one, click on red, or make my own color with that color picker.
Turns out that is not AT ALL how those colors work!
I’m sure you know all this, but for beginners (like me), while the way they function is fairly simple, it is NOT very obvious and intuitive.
I finally figured it out (and I now also understand why it wasn’t working for me) and I wrote a short article on it, with some simple examples that explain and demo how those colors work in any of the two different modes.
If you guys are interested I can send you that article and you can do with it whatever you want (add to some tutorial?).
Cheers,
~ Paul